THE FUTURE BELONGS TO THOSE WHO DARE.
Tuesday, November 30, 2010
Monday, November 29, 2010
Graphs -
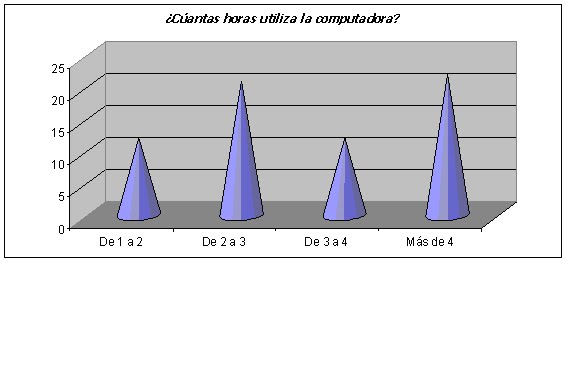
These graphs belongs to the work that students of second year in computer science and mathematics subjects, now we are going to analyze:

In the first graph we can see how many hours that girls use the computer. The total is seventy-seven. Twelve students use the computer for one to two hours; twenty-one use of two to three hours, twelve of three to four hours and more than four hours, twenty students. Many people really give much importance to the computer, the students spend much time on the computer and doesn't make other activities.

In the second graph we can see the hours students that watch television. People who were survey are sixty-seven. 41% of people watching television between one and two hours, the 33% only see two to three hours, the 22% of three to four hours and 4% more than four hours by day . We don't watch much television by day.
By Aguilera, Alvarez Nani, Ferreyra & Villán

In the first graph we can see how many hours that girls use the computer. The total is seventy-seven. Twelve students use the computer for one to two hours; twenty-one use of two to three hours, twelve of three to four hours and more than four hours, twenty students. Many people really give much importance to the computer, the students spend much time on the computer and doesn't make other activities.
In the second graph we can see the hours students that watch television. People who were survey are sixty-seven. 41% of people watching television between one and two hours, the 33% only see two to three hours, the 22% of three to four hours and 4% more than four hours by day . We don't watch much television by day.
By Aguilera, Alvarez Nani, Ferreyra & Villán
Graphs.

The first graph contains the information of the quantity of hours that the pupils uses to study.
- Seventeen per cent does not use hours to study
- Fifty nine per cent uses from one to two hours to study
- Thirty two per cent uses from two to three hours to study
- Eight per cent uses from three to four hours to study
- Only one per cent uses more of four hours to study.
SECOND GRAPH

- Thirty five per cent is for-sighted as for his studies
- Sixty five per cent studies to last moment
THIRD GRAPH

- Twenty-six per cent, out of the school area studies languages
- Six per cent, he studies music
- Six remaining per cent, has other studies
- Ninety nine per cent, does not do anything
FOURTH GRAPH

- Forty nine per cent, it is from Balvanera
- Eighteen per cent, it belongs to Saint Nicholas
- Two per cent, it is from San Cristóbal
- Other neighborhoods: thirty one per cent
FIFTH GRAPH

- Fourteen per cent lives in a house
- Eighty six per cent lives in a department
Yamila Deamigo, Victoria Rojas, Priscila Puerta, Josué Ghiso
Graphs Of Second year.


They had to do Surveys in the secondary school to every year, from first year to fifth year. In the surveys they wrote questions referred to their way of life, healthy habits and personal hygiene. There were also questions about how much technology they used or communication means and activities of recreation. They asked about habits of study, zone of residence and questions of general interest.
Luis, Alan, Gonzalo y Nicolas
Wednesday, November 24, 2010
St. Cecilia´s College
This video shows a play for the children of St. Cecilia´s College.
Those Children are blind, due to their problem, we work with senses.
Those Children are blind, due to their problem, we work with senses.
Saturday, November 6, 2010
Thursday, November 4, 2010
Wednesday, November 3, 2010
Subscribe to:
Posts (Atom)
